Scaling Graphite
This was written on request of one of my clients in June.
We use Graphite, Grafana, and Statsd extensively. We monitor everything from basic server health, detailed MySQL debugging information, web application transactions, and statistics about the communication of users’ devices. The number of metrics we generate has grown exponentially – and sometimes beyond our capacity to plan for them.
In The Beginning
Early on we had a Graphite cluster that grew from an initial machine to a
handful. Many had different attached storage sizes and we used Graphite’s
relay-rules.conf to setup regular expressions matching specific groups of
metrics to a storage location. We grew the cluster by adding “sub-clusters” of
2 or more machines that would use Graphite’s consistent hashing to essentially
build a storage pool. With all the differences, even though we built the entire
system with Puppet, it was difficult to get right.
Our initial problems included bad entries in the CLUSTER_SERVERS setting in the
Graphite web application. Graphs took forever to render as the webapp had to
time out on non-existent Graphite servers. We constantly did battle with which
server would fill up next and how to further break down the metrics into more
groups and add storage and hardware.
Let’s not forget our UDP friend, Statsd. We were receiving upwards of 700,000 UDP packets per second at the one Statsd daemon on the main Graphite relay, while the Node.js daemon only handled about 40,000 packets per second. The other 640,000 metrics per second were bring dropped. Testing further showed that the Node.js code would drop a significant number of metrics as the rate neared 40,000 packets per second. We knew that Statsd was under-reporting but we didn’t know how badly until we broke out our network best-friends: wireshark and tcpdump.
Load Balancing
The requirements of other components of our systems work best on bare metal, and our hosting provider excels at bare metal as a service. The load balancers available were hardware solutions and charged by the connection – which just wasn’t an option for Graphite and Statsd TCP and UDP streams. I also had to be able to load balance Statsd UDP traffic. That removed HAProxy which is one of our primary load balancing tools.
However, I have worked with LVS/IPVS load balancing setups for years and I knew
it had the horse power for the job, even on reasonably priced hardware. Of
course, if I send the same Statsd metric to multiple daemons via a simple
round-robin load balancing algorithm, all the daemons will in turn report that
metric to Graphite. With Graphite, when you send duplicate timestamps for the
same metric, the last write wins – which makes your Statsd data useless. Like
carbon-relay.py I needed a Statsd proxy that could run a consistent hash
algorithm on the metric and always direct it to the right Statsd daemon.
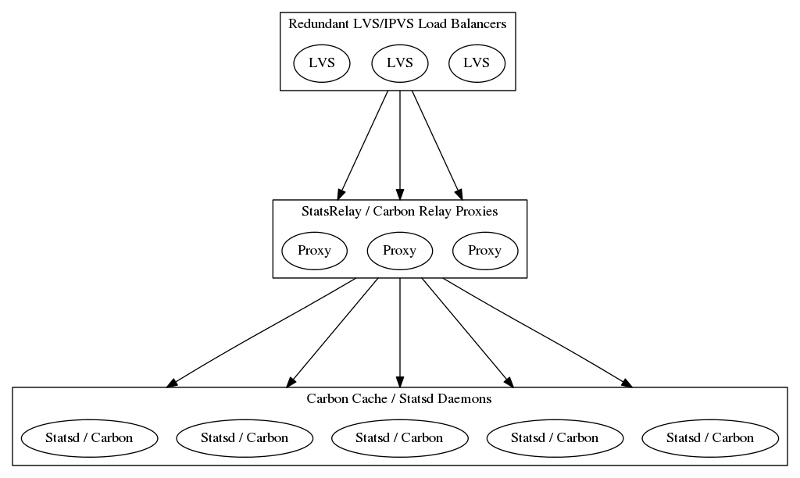
I used a tiered load balancing approach to solve these problems. I load balanced across proxies which, in turn, knew the right host to send data toward by application specific inspection. This worked out well, because the proxies couldn’t handle on their own the full traffic load, and the end points that stored the data turned out to have other limiting issues on their rate of ingestion.
Project: StatsRelay
Uh, what Statsd proxy? The Statsd team had begun to work on a proxy.js to do
just this. Great! However, testing showed the same Node.js limitations with a
maximum of 40,000 packets per second. Scaling to 200,000 packets per second
consumed 8 cores and 8G of RAM and continued to drop packets. A lot of packets.
This was not going to scale.
I have found Go to be a really fantastic language for dealing with operations tasks. Type safety does wonders to keep bugs out of the code, its nearly as fast as C, and makes very efficient programs. Scaling isn’t about just the horizontal or vertical – you also need efficiency.
I created the StatsRelay project to fill this need. Written in Go it is benchmarked at consuming 250,000 UDP packets per second, no packet drop, using 10MiB of RAM and about half a CPU core. To help make the underlying Statsd daemons handle more metrics with less packet loss StatsRelay sends multiple metrics per packet. String operations are always cheaper than making system calls. Now this we can work with.
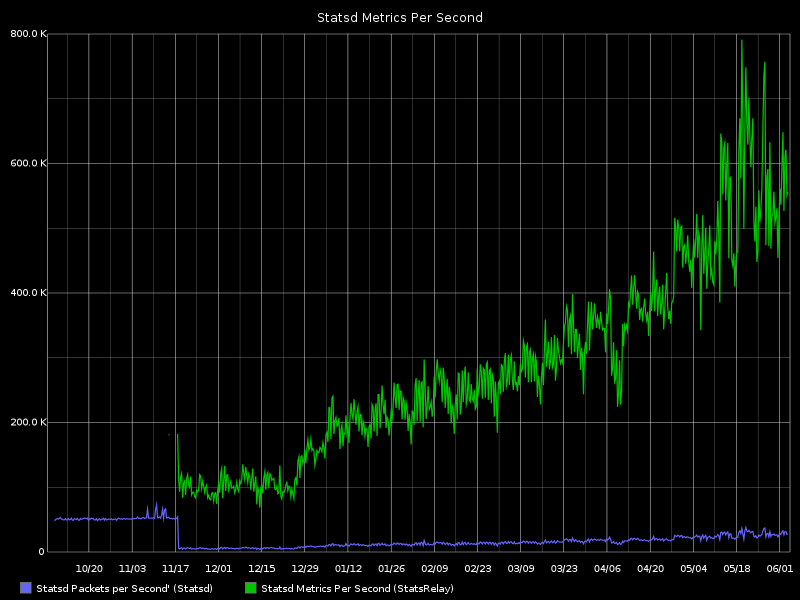
This graph shows the processed Statsd metrics per second flat lined at the beginning. The green is the rate handled by StatsRelay and shows that we’ve scaled quite a bit from the capabilities of a single Statsd daemon. It also helped that we shut down an unintentionally metric heavy source that wasn’t providing a lot of value.
Graphite Migration #1
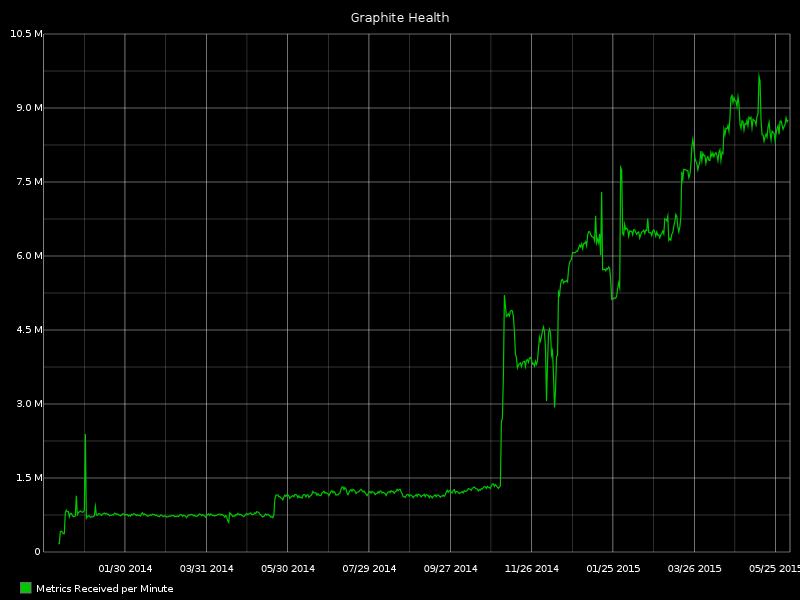
When looking at our historical storage consumption, I calculated that we would continue to grow at about 1.5x that rate. With this information I built a cluster using these techniques that I estimated would last 2 years. This was October and November of 2014. Find that on the metric ingestion graph above for the full humor value. I build some Fabric tasks to use a set of tools called Carbonate to migrate the data over. Things went smoothly and successfully.
By the end of January the new “two-year” cluster was full. I had roughly some 30 TiB of Whisper files.
Graphite Migration #2
There’s no problem that scaling horizontal wont solve! (You know, the complete anti-theme of this article.) We ordered more servers. Got them configured and prepared for the cluster expansion. I tuned my Fabric tasks to run the Carbonate tools with as much parallelism as I could. (There was one lunch I remember coming back from to find one of our admin hosts nearly dead from a test run of the Fabric task.) Tests worked in about 2 days. Finally, I ran the full rebalancing.
The cluster rebalance took more than 7 days during which query results were mostly useless. I knew query results would be “weird” until the rebalance completed – but 7 days was much longer than my worst case time expectations.
My tests had purposely left the new nodes populated. This had the permissions
set correctly and was an attempt to lessen the amount of query weirdness. The
Python implementation of whisper-fill.py took much longer than simply
rsync’ing the data over. 2 to 3 seconds per metric times roughly 2 million
metrics in flight with 4 machines running in parallel is 11 to 17 days. Oops!
Available Whisper storage: 60TiB.
Project: Buckytools
I was having other issues with my Fabric tasks. Wrapping everything in shell and piping through SSH was starting to break down. The Python implementation of the fill algorithm was way too slow. The local disk space requirements to move around metrics were becoming painful. I needed an efficient client / server API with a high degree of concurrency. Sounds like Go.
I began work on a new project called Buckytools. The server end is a REST API that can lay down new Whisper files, retrieve Whisper files, run the fill operation on an existing Whisper file with new data, list metrics on disk, and be knowledgeable of the consistent hash ring. The client compares hash rings to make sure they are identical, creates tar archives, restores tar archives, finds metrics in the wrong locations, and rebalances the cluster. Also, lots of other administrative tasks for working with a large consistent hashing Graphite cluster.
There are two key pieces to this project. First, it implements the Graphite
consistent hashing algorithm in Go. Secondly, it also implements the fill
algorithm in Go. With good use of go routines and Go’s amazing net/http
library this turned out to be significantly faster that previous tools.
Graphite Migration #3
Its May, 2015. A new tier of application servers has pushed the cluster into the red for storage space. Instead of working toward a Summer over-haul, I needed more space. This was the moment I had been prepping for with Buckytools. Similar to migration #2, I added another 4 storage nodes and needed to rebalance about 2.3 million metrics. Also, learning from that migration I sure sure to clear off any data on the new nodes from my tests.
GOMAXPROCS=4 bucky rebalance -w 100
Speed. 2.3 million metrics in 21 hours. The balance process removed old metrics on a successful heal resulting in much less query weirdness with partial data. The migration was going wonderfully well…
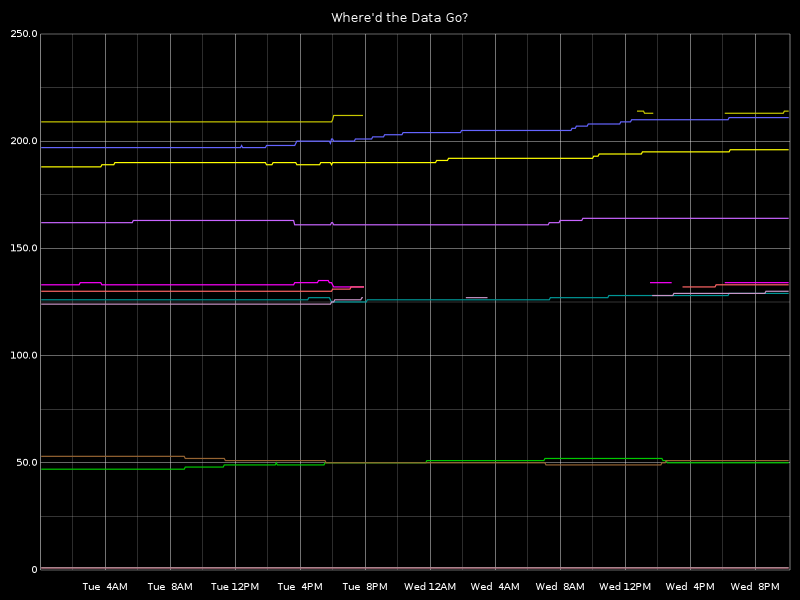
Until carbon-cache.py daemons starting crashing due to ever increasing
memory usage. Once I restarted them all I realized that much of the data
received during the 21 hour window had vanished. I examined metric after
metric to see large gaps with the occasional string of data points for this
time window. I was…let’s say I was upset.
Available Whisper storage: 88TiB.
You Wouldn’t Like Me When I’m Angry
This smelled familiar. We’ve encountered this bug before on the Graphite
cluster and chalked it up to a fluke. This time it manifested in every
carbon-cache.py daemon on the new data nodes. Future migrations would
come, so this bug had to go.
Turns out whisper.py that manages the Whisper files on disk doesn’t ensure
that files will be closed. (Versions 0.9.12 and 0.9.13.) We also have
Graphite configured to lock files via a flock() call. When an exception
occurred in whisper.update_many() (called from carbon-cache.py’s
writer thread) the Whisper file would not be closed and in most cases the
Python garbage collector would come along and close the out of scope file
descriptor and unlock the file. However, with enough pressure on the
carbon-cache.py daemon I hit the condition where an exception occurred
but the file descriptor had not been garbage collected before
carbon-cache.py needed to write to that metric again. At this point the
daemon attempted to obtain an exclusive lock on the file and the writer
thread deadlocked. The thread had two open file descriptors to the same
Whisper file.
This is fixed in the master branch of the Whisper project and I’m working on a backport to 0.9.x. After we’ve stress tested a new Graphite cluster setup I’ll get this in a pull request.
The Future
Our Graphite cluster is growing very quickly and we know that adding 4 nodes at a time every couple months wont scale for long. I’m planning to rebuild the cluster to scale past the holiday shopping season which is our busiest time of the year. So, besides just adding more machines, what are we looking at doing?
- Statsd: Pull this off the Graphite storage nodes so it can be scaled independently. We’re running almost 30 daemons to keep up with load and due to consistent hash ring unevenness and Node.js being what it is there is still packet loss. Use a more efficient implementation of Statsd. Bitly’s Statsdaemon looks very promising.
- Dedicated Query/Render machines: The user experience has different scaling requirements that the rest of the cluster. Especially caching.
- Evaluate carbon-c-relay: A much more efficient consistent hashing metric router. Pull all metric routing off of storage nodes. This allows me to not have storage nodes on the LVS/IPVS subnets since I’m going to have more nodes than IPs there.
- Alternate consistent hashing algorithms: A feature of
carbon-c-relayas I’ve noticed we have quite a few collisions in the hash ring. Graphite’s consistent hash ring implementation only has 64k slots.
That’s some of our thoughts for the immediate future. There is lots of room to grow and scale and more challenges and bugs to come. At some point we will need to consider alternate technologies for storing time series data and how to port all of our existing line and pickle protocol based tools. Currently, the Graphite ecosystem is very popular here and gives us much value. We also think that, with our data patterns, Whisper is a fairly efficient data store for us. We expect to be scaling Graphite into the future, and writing a few more articles about it.