Failure to Math: Graphite and nonNegativeDerivative
After a bit of Graphite maintenance I had several complaints about graphs being “weird.” Upon inspection they had unusual spikes, data gaps, and negative results where negative numbers made no sense. “L”-shaped spikes describes them the best, I think.
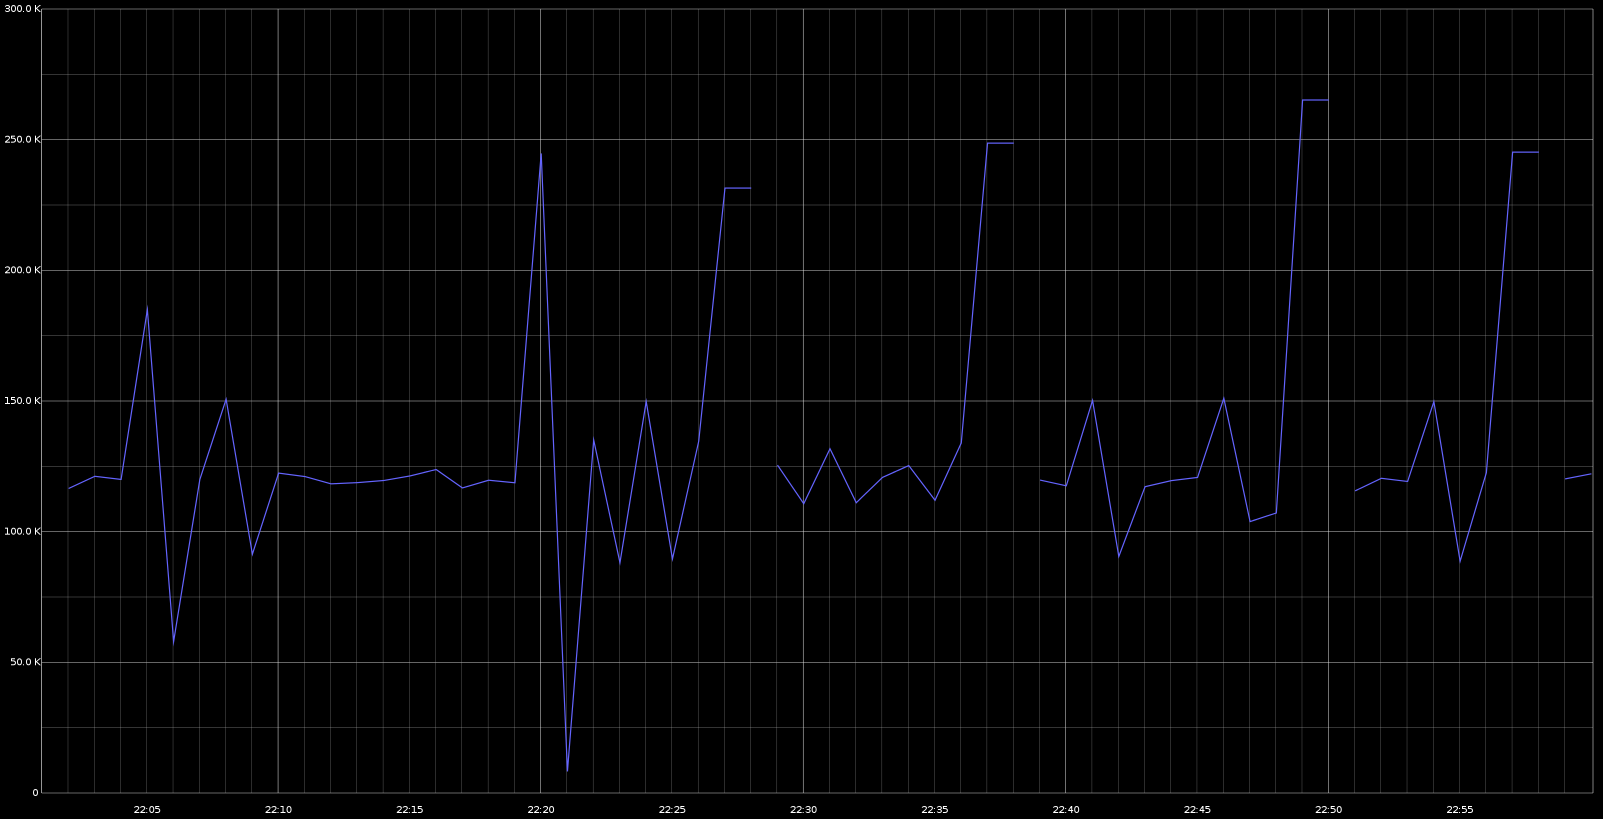
This turned out to be a counter metric, like the number if packets your NIC has received. So, a look at the raw data showed the following:
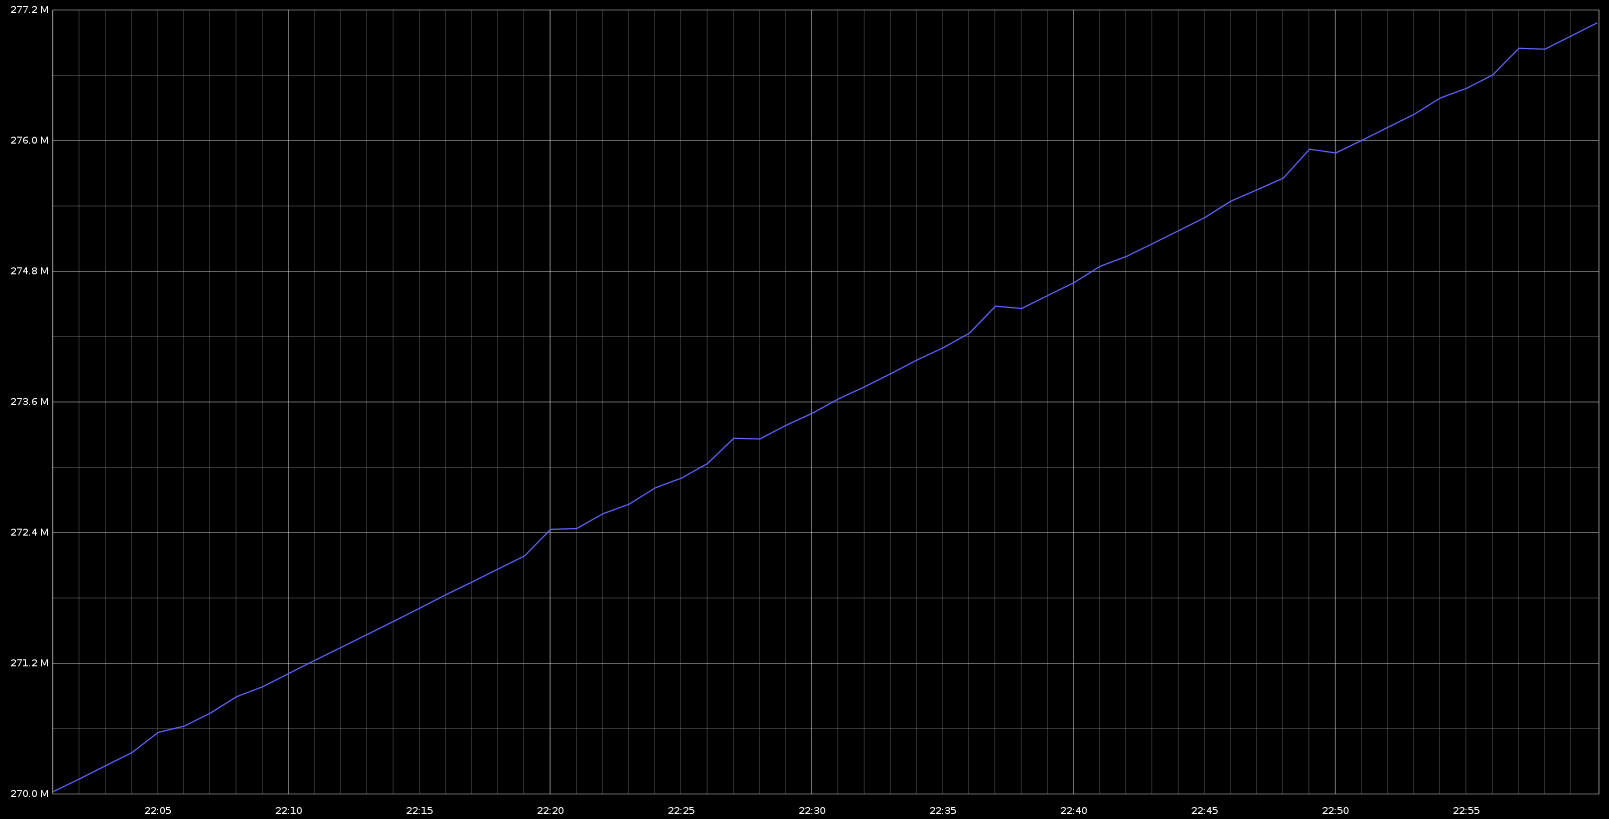
This is the same data but I’ve removed the nonNegativeDerivative()
function. To everyone’s surprise, this counter occasionally decreases! This
lead us to a problem with the client reporting the metrics.
Let’s review what nonNegativeDerivative() does:
Same as the derivative function above, but ignores datapoints that trend down. Useful for counters that increase for a long time, then wrap or reset. (Such as if a network interface is destroyed and recreated by unloading and re-loading a kernel module, common with USB / WiFi cards.
So data that trended down was removed from the top graph making it look like it had missing data points. Of course, the bogus data was only amplified by the derivative function.
So, due to the fact we had bogus data coming in, our normal method of showing the rate of change here produced very unusual behavior. This is, however, not a fault or error in Graphite. The real question I ended up being left with is how a restart of the load balancer for the Graphite cluster caused a client or two to misbehave.